Building a Personal Windows 11 System Monitoring Dashboard with PowerShell
- fabztechtips
- May 18
- 3 min read
Over a few days, I took on a personal IT engineering project focused on automation, monitoring, and real-time reporting. The goal was simple: build a lightweight System Monitoring Dashboard for my Windows 11 laptop using nothing but PowerShell and built-in Windows functionality — no third-party monitoring tools required.
What started as a small scripting exercise quickly evolved into a fully automated monitoring solution capable of collecting live system metrics, logging performance data, generating dashboards, and triggering alerts when thresholds were exceeded.
Project Overview
The dashboard continuously monitors key areas of system performance and presents the information in an easy-to-read HTML interface while simultaneously logging historical data to CSV files for later analysis.
The project was designed to simulate the kind of lightweight monitoring and automation commonly seen in enterprise environments, but adapted for a personal workstation.
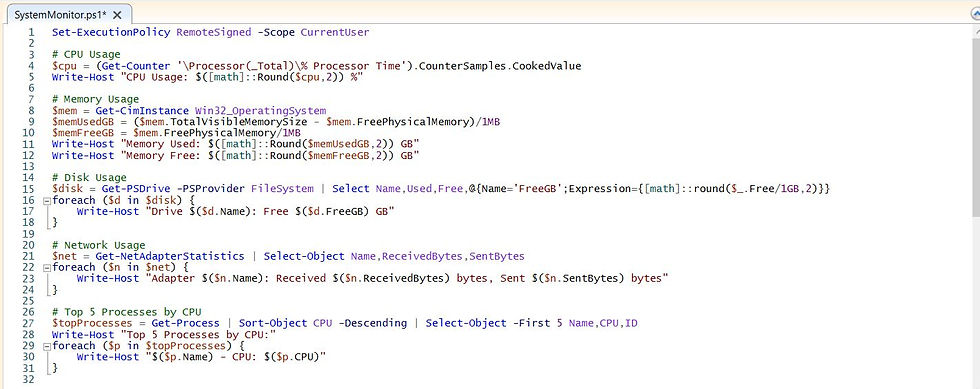
System Metrics Collection
Using PowerShell, I created scripts to collect a variety of real-time system statistics, including:
CPU usage (% Processor Time)
Memory usage (used vs free memory in GB)
Disk usage and available space per drive
Network traffic statistics (sent/received bytes per adapter)
Top 5 CPU-consuming processes
This allowed me to create a live overview of system health directly from native Windows performance counters and system commands.
Automated Data Logging
To provide historical reporting and trend analysis, all collected metrics are automatically exported into CSV log files with timestamps.
This creates a running history of:
CPU spikes
Memory consumption patterns
Disk usage trends
Network activity
Resource-heavy processes
Having historical logs makes it possible to analyse performance issues over time rather than relying solely on live monitoring.

HTML Dashboard Generation
One of the most rewarding parts of the project was generating a dynamic HTML dashboard directly through PowerShell.
The dashboard provides a clean visual overview of:
Current CPU usage
Memory statistics
Disk space availability
Top running processes
Network activity
Because the HTML file updates automatically, it acts as a lightweight monitoring portal that can be opened at any time in a browser for a quick system health check.

Real-Time Alerting System
To make the monitoring more proactive, I implemented local popup alerts that trigger whenever critical thresholds are exceeded.
Alerts currently activate when:
CPU usage exceeds 80%
Free memory drops below 1 GB
Free disk space drops below 10 GB
Originally, the plan was to send email alerts via SMTP. However, I encountered authentication limitations due to using a passwordless Microsoft account on Windows 11.
Because Task Scheduler could not securely store credentials for unattended execution, I adapted the design and switched to local popup notifications instead.


Challenges and Solutions
SMTP Email Alert Limitations
One of the biggest challenges involved implementing email notifications through Task Scheduler.
Since my Windows account uses passwordless authentication, Task Scheduler could not save credentials required for unattended background execution.
Task Scheduler Workaround
To resolve this, I modified the scheduled task configuration to:
“Run only when user is logged in”
This allowed the monitoring scripts to execute automatically without requiring stored credentials.
Instead of abandoning the alerting functionality entirely, I implemented local popup notifications to maintain real-time monitoring capabilities.

Technical Skills Demonstrated
This project allowed me to demonstrate several practical IT engineering and scripting skills, including:
PowerShell scripting and automation
Windows system monitoring
CSV data export and reporting
HTML dashboard generation
Event-driven alerting
Troubleshooting authentication and scheduling limitations
Real-world problem-solving and workflow adaptation
Final Outcome
The completed project resulted in:
A fully automated Windows 11 monitoring solution
Continuous CSV-based system health logging
A dynamically updating HTML dashboard
Real-time popup alerts
A practical demonstration of scripting and automation skills
Most importantly, the project reinforced how much can be achieved using native Windows tooling and PowerShell alone.
Reflection
Projects like this highlight how personal initiatives can become valuable demonstrations of technical ability.
Even on a single laptop, it was possible to simulate enterprise-style monitoring concepts, overcome authentication restrictions, and build a genuinely functional monitoring platform from scratch.
Beyond the technical implementation, the project also reinforced the importance of adaptability. Real-world environments rarely behave perfectly, and solving unexpected problems is often just as valuable as building the original solution itself.


Comments